A recording of the vowels A, E, I, O, U
Introduction
Study the spectrum of a human voice as it speaks each vowel and then as it sings each vowel.
Material
A spectrum analyzer, such as the Audacity program available for free for Macintosh and IBM compatible computers.
The free program is available at: http://audacity.sourceforge.net/ , it was created by a team of volunteers.
A microphone, you may choose to use the built-in microphone on your computer.
To Do and Notice
Open the Audacity program.
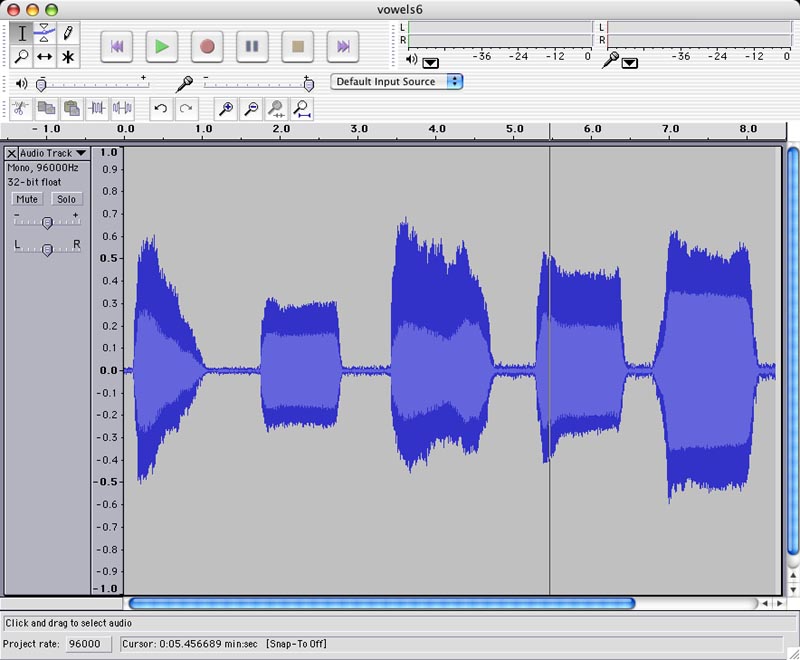
Hit the record button on the tape-recorder-like command bar, it is marked with a red circle.
Have someone speak the vowels "A,E,I,O,U".
Hit the stop button on the command bar, the brown square.
Select the section you want to analyze by clicking and dragging over the spectrum.
For example select the "E" sound.
Use the zoom in and zoom out controls under the "View" menu to look at the spectrum of the "E" sound.
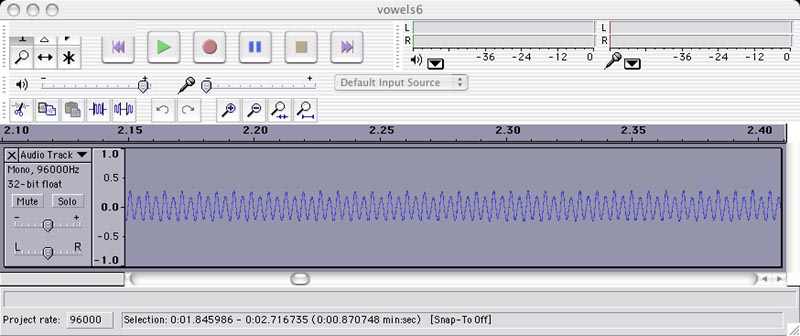
Notice how there are at least two frequencies present in the waveform of the vowel "E".
After you have selected a sound you can plot its spectrum by going under the "View" menu and choosing, "Plot Spectrum."
For example select the spectrum of the "O" sound, then plot its spectrum.
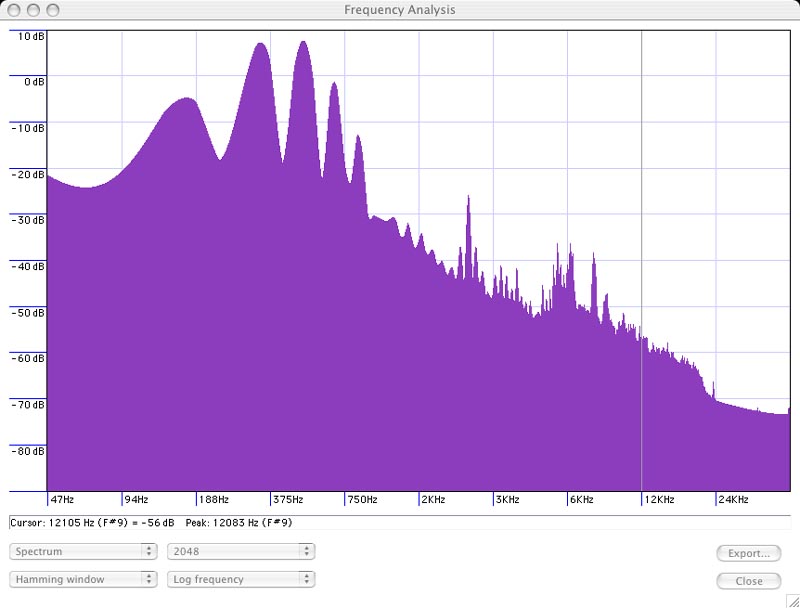
Here is the spectrum of a spoken "O"
Notice how there are many frequencies present in the spectrum of the spoken vowel "O." You can move the cursor to locate the frequency of each peak in the spectrum.
The frequency axis is logarithmic so the peaks get closer together at higher frequencies. You can also choose a linear frequency scale which emphasizes the higher frequency components of a sound while compressing the low frequency components. Both views together will give you a better appreciation for a sound.
You can also observe the spectrum change with time. To the left side of the waveform display choose "Audio Track," a menu will appear, on that menu choose "spectrum." The spectrum of the sound will be displayed as a function of time. In this plot time is the horizontal axis, frequency is the vertical axis, and brightness or color is the loudness of the sounds.
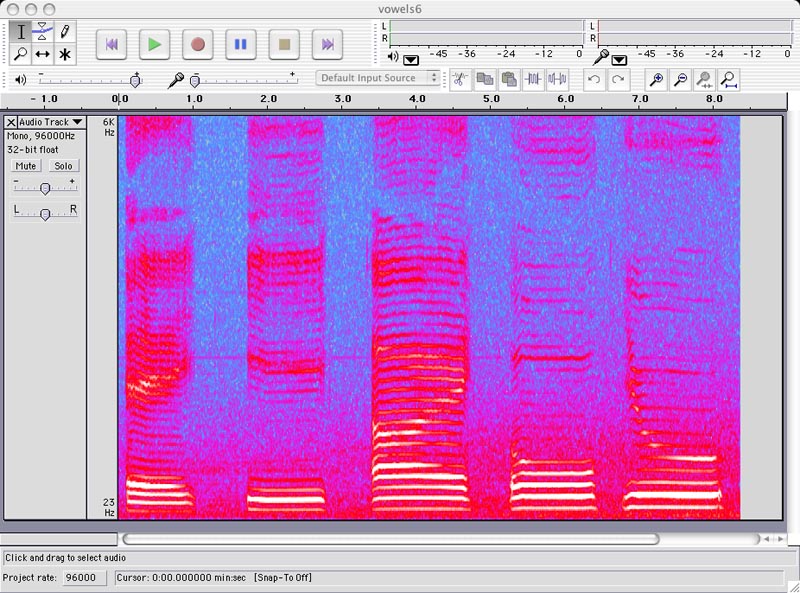
Examine the sound spectrum versus time for the vowels.
Notice the equally spaced horizontal lines. These are the harmonics of the vocal chords, dozens of harmonics are present.
Compare a male and a female voice and notice how the spacing of the harmonics for the female voice is greater than for the male voice. The fundamental frequency of the average female voice is higher than that of the average male voice.
Bands of frequencies are amplified by the shape of the vocal track.
Notice how the "A" sound at the left has a loud resonance at low frequencies and a higher resonance that increases in frequency with time.
Each vowel has its own pattern of amplified frequencies versus time.
The amplified bands are called the formant frequencies of the vowels.
Part 2, The Vowels of an Opera singer.
After recording the spoken vowels, record the vowels sung by an opera singer.
Compare the "Audio Track" "Spectrum" for the sung vowels with the spoken vowels.
Notice the similarities and differences.
The Opera singer creates the same overall pattern of amplified frequencies for each vowel, but does so by shaping the vocal track in a different way than when speaking the vowels. This allows the singer to create very loud vowels.
Going Further
The audacity program allows you to record and analyze the frequency components of audible sounds.
Under the "Audacity" menu the "preferences" for "quality" allow you to select the sampling rate, I chose a very high sample rate of 96,000 samples per second to study the human voice. The maximum rate the program allows is 100,000 samples per second.
Also under the "Audacity" "Preferences" menu you can choose "Spectrograms" and choose the FFT size. FFT stands for fast fourier transform. A larger number of samples produces a higher resolution spectrum, I chose 4096 samples. Under this same menu you can choose the maximum frequency. Often I start with a high frequency and then reduce it to include all the interesting frequencies and also to give me the greatest detail.
References
This is a "Snack" version of the Exploratorium exhibit "Sound Spectrogram" which shows a real time plot of the frequencies present in a sound. The exhibit uses a minicomputer, Now, after a decade it can be duplicated on a personal microcomputer.
|
Scientific Explorations with Paul Doherty |
|
27 July 2005 |