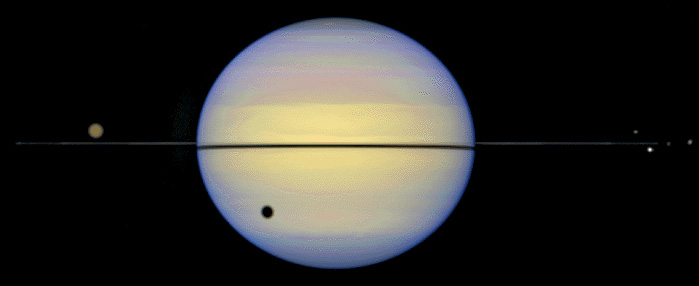
Saturn in an edge-on view of its rings from the Hubble Space Telescope. Titan is the moon above the rings to the left. An eclipse shadow from Titan makes a dark spot on Saturn.
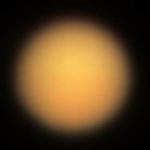
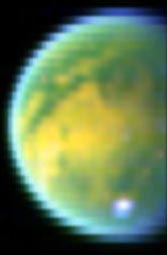
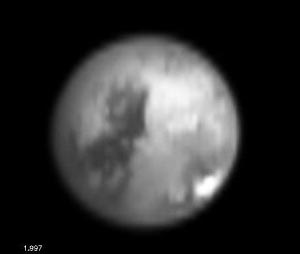
True color image of Titan from the Hubble space
telescope.
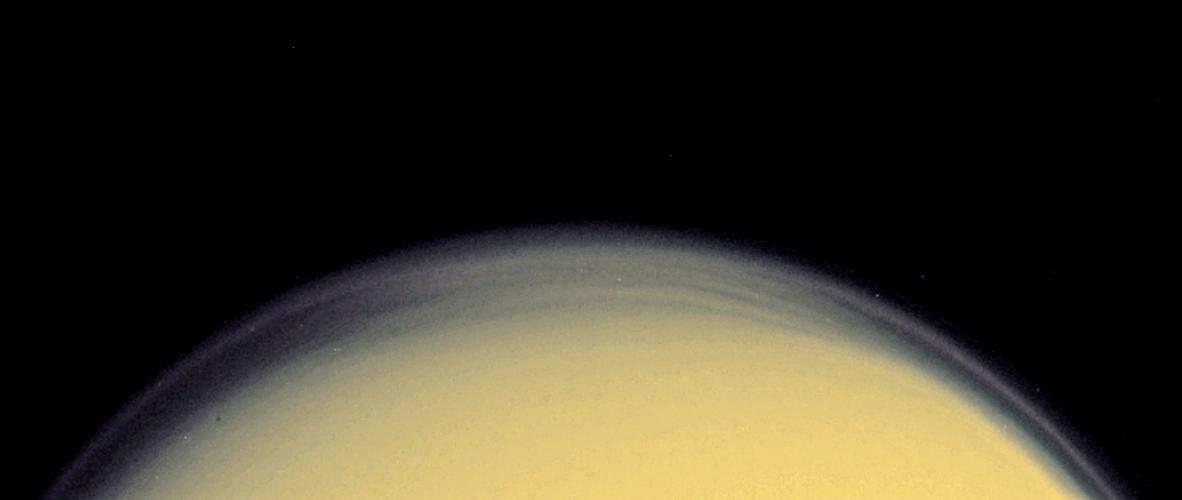
Titan, Titanic Moon of Saturn
Close Pass, October 2004
True color image of Titan from the Hubble space
telescope.
Titan was discovered by Christian Huygens in 1655. It is bigger than the planet Mercury and of all the moons of the solar system it is second to Ganymede in diameter, The diameter of Titan is 5150 km. (If you measure the diameter of Titan to the top of its 200 km high clouds then it becomes the largest moon in the solar system.) It is in orbit 1.2 million kilometers from Saturn. Titan is made of half rock and half water ice.
Demo Using our model of Saturn and its rings with a beachball Saturn 12 inches in diameter, the earth is a ball 1.1 inches in diameter and Titan is a ball 0.5 inches in diameter. It takes 23 Titans lined up to stretch across the diameter of Saturn. Two Titans almost stretch across the earth. Titan's orbits Saturn about 9 A-ring diameters from the planet. (actually 8.5) in our model Titan is 300 inches or 24 feet from Saturn's center.
Titan is the only moon in the solar system with an atmosphere, and what an atmosphere it has! The pressure at the surface of Titan is 1.5 times the pressure on earth. The atmosphere is made of nitrogen with a few percent methane (CH4) and many interesting organic molecular impurities such as ethane (C2H6), propane (C3H8), acetylene (C2H2), hydrogen cyanide (HCN), and carbon monoxide (CO). The moon is covered with a red haze made from microscopic hydrocarbon droplets. The organic molecules are created when ultraviolet light from the sun breaks apart methane. Some released hydrogens escape into space, others react to create organic molecules. A similar thing happens to hydrocarbons from automobile exhaust in Los Angeles where solar ultraviolet creates hydrocarbon smog.

The surface temperature is 94 K, or -179 C (-290 °F). This is warmer than the temperature needed to make liquid nitrogen, 70 K. Methane is liquid at this temperature, and so is ethane. So Titan may have flammable seas (thank goodness there is no Oxygen around.) Higher in the atmosphere it becomes colder and nitrogen can form liquid drops and methane ice can form clouds.
Titan is far from the sun, so the sun is 100 times dimmer than on earth, it also has a smoggy atmosphere which further reduces the light. The surface of Titan is 1000 times dimmer than the surface of the earth.
Demo Peep astronaut on Titan. It is cold on Titan. Take a Peep astronaut to Titan. Immerse the Peep in liquid nitrogen then tap it with a hammer. The Peep will shatter.
Demo Cold Finger. Put a hand into a latex glove. One finger of the glove is full of a hot dog, unknown to the audience. Stick the "finger" which is actually the hot dog into the liquid nitrogen. To show the effects of the cold temperatures of Titan on a human, Hit the finger with a hammer and shatter it. Then confess to the audience that it was a hot dog.
Demo Even though there are hydrocarbon molecules on Titan they will not burn. Put liquid nitrogen into a tank as it boils it will drive out the earth's atmospheric oxygen. Put a burning cigarette lighter into the tank. Notice that the lighter goes out.
Titan is covered by a 200 km thick haze, which completely hides the surface. We have seen the surface using the Hubble telescope using infrared light that penetrates the haze. We have looked at the surface with radar from earth and found a bright region, which is rough and therefore not an ocean. We will see the surface with radar on the Cassini spacecraft.
Demo Use a thermal infrared camera. Have a person put a bag over their head. Look at them in visible light and you cannot see their face. Look and them in infrared light and the bag becomes transparent. You can see their face. It is the same with Titan.
Combining images in several wavelengths gives this color image of
Titan's surface. The white spot is made of methane ice
clouds
Demo Put a steel bowl on a ringstand. Pour some liquid nitrogen into the bowl. Oxygen will condense on the outside of the bowl, run down under gravity and drop off the bottom. If one of the drops of LOX, liquid oxygen, hits a smoldering splint of wood the splint will burst into flame.
On Titan gasses that are cooled below their condensation temperature turn into liquid drops and create clouds, rain, and maybe rivers or oceans. Gasses that are below their freezing point make ice crystals and snow which may fall on the surface as drifts.
Titan Close Pass, October 2004
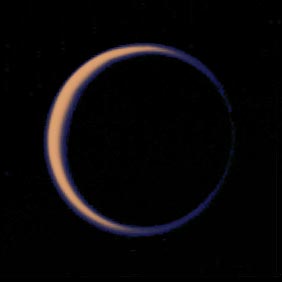
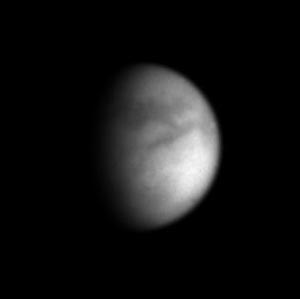
Human Eyes see a relatively narrow region of the electromagnetic spectrum.
Here's how Titan looks to the human eye.
Eyes see a range of wavelengths from violet, 400 nanometers, to red, 800 nanometers, they thus see a factor of 2 in wavelength and also frequency.
Common frequencies of the electromagnetic spectrum studied by scientists range over more than 20 orders of magnitude.
The range of the spectrum is portrayed in the Exploratorium Electromagnetic Spectrum Chart
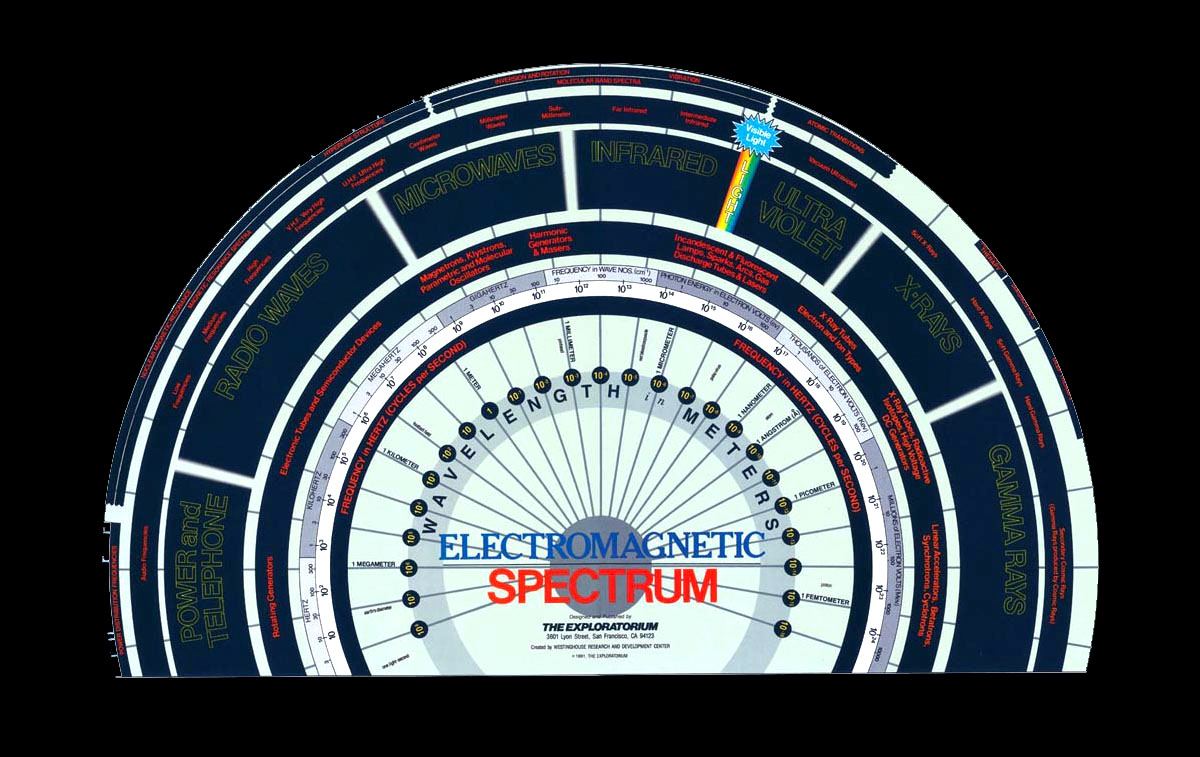
and on the NASA electromagnetic spectrum pages.
There are two imaging systems on the Cassini spacecraft that make images using visible light.
The ISS, Imaging Science Subsystem, which spans the near infrared, visible and near ultraviolet range of the spectrum.
200 nanometers to 1,100 nanometers.
and the
VIMS, Visual Infrared Mapping Spectrometer
which covers the range from the near ultraviolet at 350 nanometers through the visible to 5,100 nanometers (5.1 micrometers) wavelength.
5.0 micrometers is about one ttenth the diameter of a human hair.
The VIMS instrument can take images at 352 different wavelengths. The researchers assembled these into a movie that scrolls through the wavelengths, notice how the planet is invisible in some wavelengths while at others the surface appears through the clouds. The wavelength of the light used to make each image is shown at the lower left, the unit of wavelength is the micrometer.
Click on this image to go to the QuickTime movie.
As you can see in the movie, some infrared wavelengths penetrate the atmosphere of Titan and allow us to see the surface.
Choosing one of these wavelengths the spacecraft made a movie of the rotating surface as it approached Titan.
Notice how the image grows larger as the spacecraft approaches Titan, notice also that Titan rotates,
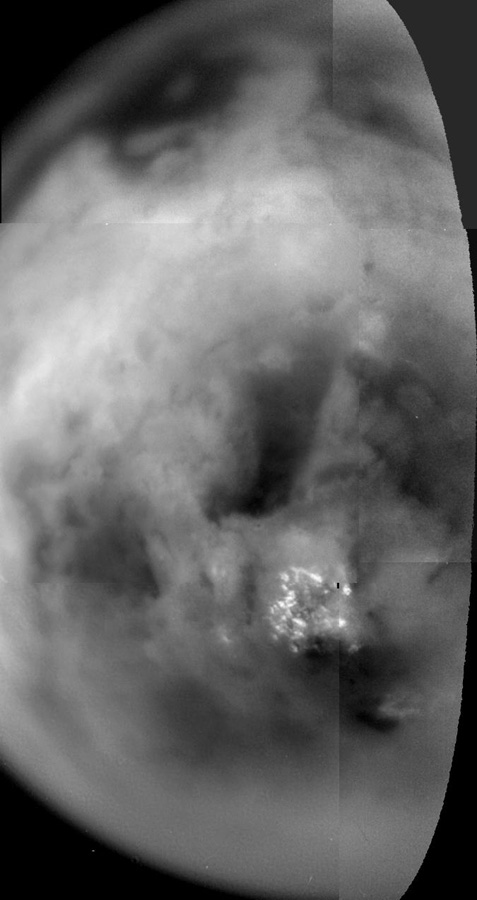
Several images of Titan in different wavelengths were combined to make a false color image.
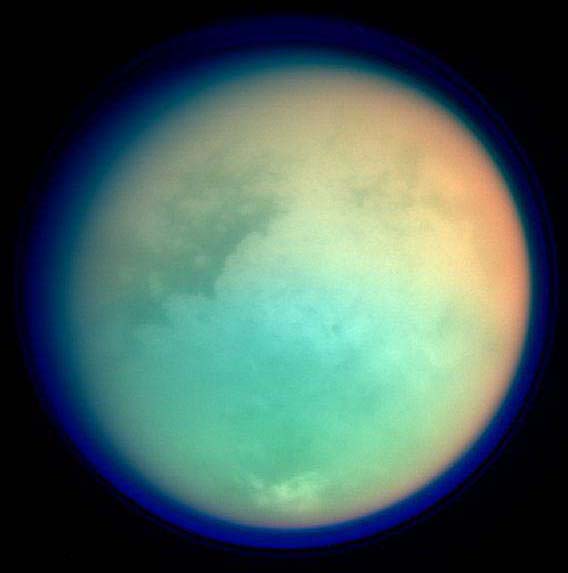
In this image two normally invisible infrared wavelengths that are absorbed by methane are colored red and green while ultraviolet is shown as blue. The white clouds near the bottom are detected in an infrared wavelength that is not absorbed by methane.
Dark and light regions appear on the surface, the large white region is the "continent" Xanadu. There are white clouds near the south pole at the bottom of the image. A haze layer shown in blue surrounds the planet. At the moment scientists do not know what the difference is between the dark and the light regions.
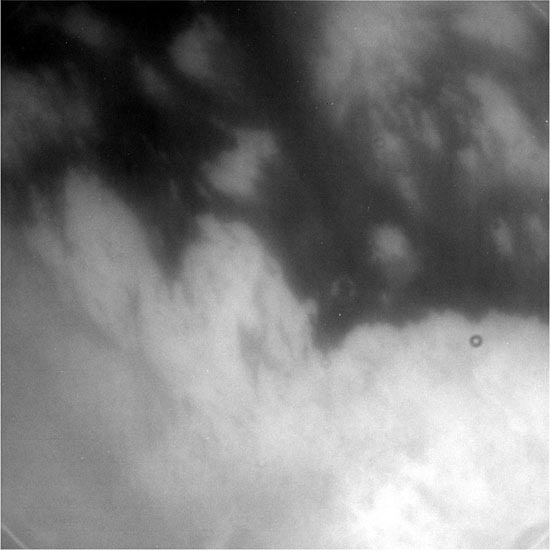
Cassini passed close enough to Titan that close views of the surface were obtained through the clouds.
Using infrared wavelengths.
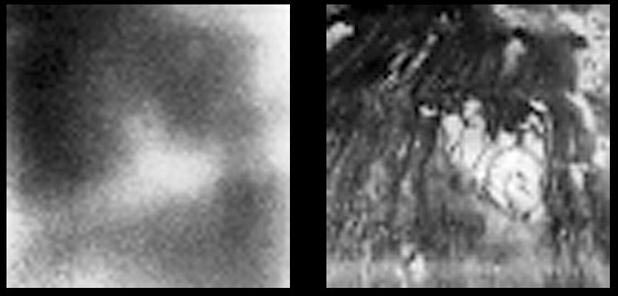
The view on the left was with 1000 nanometer infrared and is blurred by the atmosphere, the view on the right at 2000 nanometers is clearer, but we still don't understand what we are seeing.
Here is the view of the landing site for the Huygens probe, due to land in January, 2005.
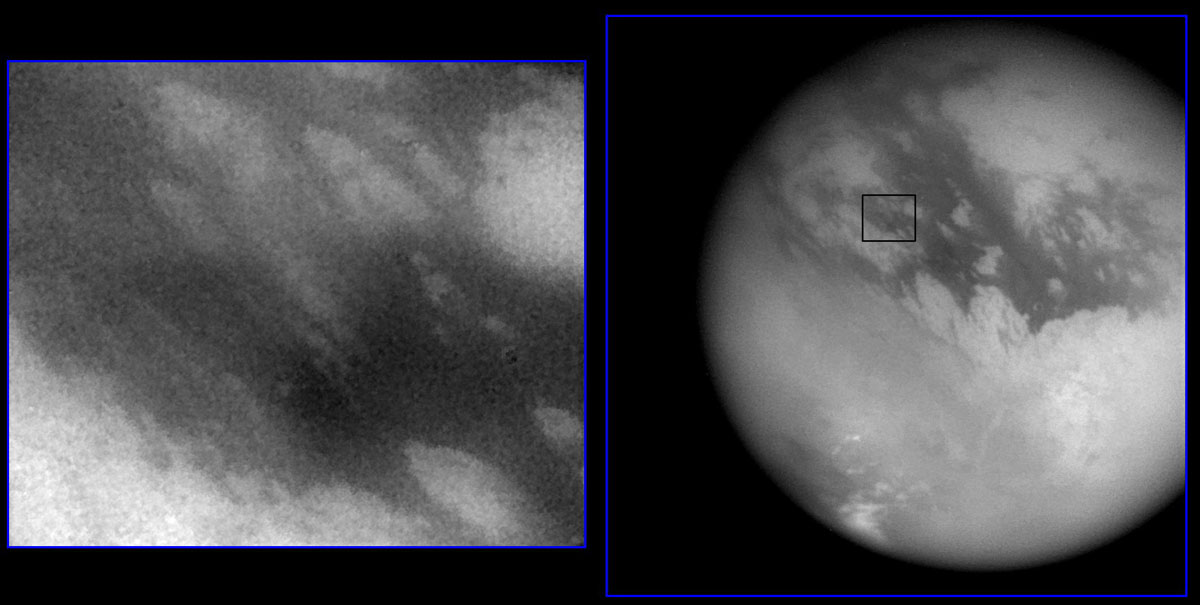
Notice the streaks in the left hand image, these look like wind streaks, that seem to indicate a fluid flow of some sort from the top left to the bottom right.
Exploratorium Exhibit Aeolian Landscape.
In one close-up showing the contact between dark and light regions a circular feature looks like a crater rim.
The Cassini spacecraft carries a radar transmitter and receiver.
It operates at a frequency of 13.78 GHz, gigahertz, in what is called the K- mu band written Ku band, it sends out microwaves with a wavelength of 2 cm or 0.79 inch, a wavelength just wider than the width of a finger.
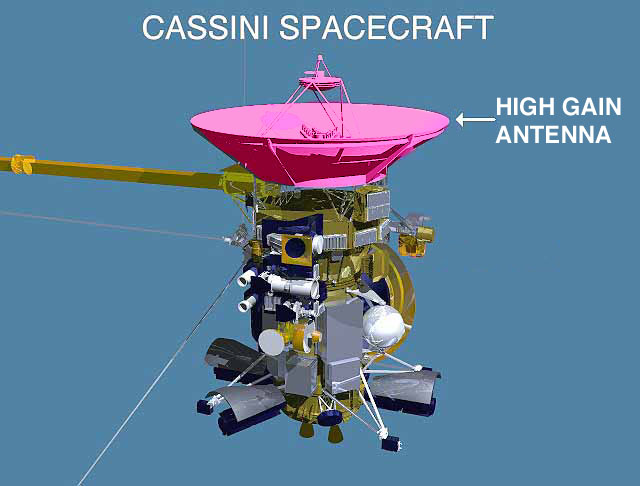
The large parabolic communications antenna on Cassini is used to
transmit and receive radar pulses.
Click the image to see an enlarged version.
Scientists can use radar to see the surface of titan beneath the clouds.
Radar signals are sent out by the antenna on the spacecraft, they then bounce off the surface and return to the spacecraft. Like a sound echo does when you shout at a mountain wall.
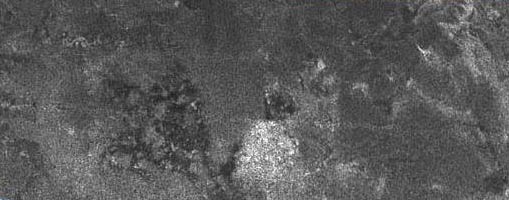
In this radar view bright regions are rough and dark regions are smooth. One way to make a smooth region is with the surface of a liquid.
Demo Use a video camera with a light source held near the camera to photograph a smooth plastic surface like the surface of a CD jewel case against a black background. Notice that the case looks black. This is because the light bounces off the case and none returns to the camera. Now scratch the surface with very rough sandpaper. Notice that the surface looks whiter. The scratches scatter the light back to the camera.
The radar receiver can also receive radiation from Titan. Here is the emission from the moon.
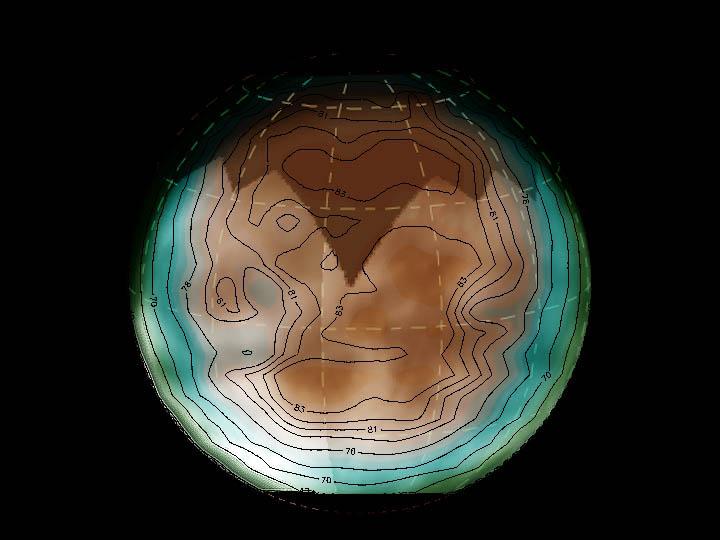
Click on the image to enlarge.
CIRS
far-infrared (10-600 cm-1) and mid-infrared (600-1400 cm-1)
near-IR (NIR, 0.7 to 5 µm in wavelength), mid-IR (MIR (also intermediate-IR (IIR)), 5 to 30 µm) and far-IR (FIR, 30 to 1000 µm). However, these terms are not precise, and are used differently in various studies.
pit viper The spectral sensitivity of the pit organ receptors covers a range from at least 400 to 10,600 nm
Radio and Plasma Wave Science
50 Hz to approximately 10 kHz and 10 kHz to approximately 80 kHz.
25 Hz to 12.6 kHz.
0.1 Hz to 2.5 kHz
Ultraviolet Imaging Spectrograph, UVIS
55.8 nm to 190 nanometers
Bees see ultraviolet light with wavelengths as short as 300 nm, they can also see wavelengths up to 650 nm.