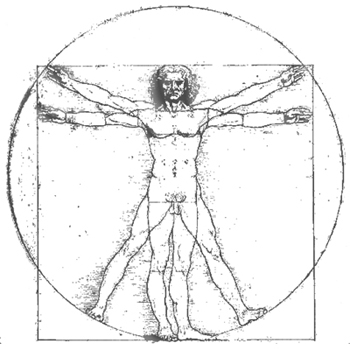
Vitruvian Teacher
Plot wingspan versus height
Measure the height and the wingspan of a group of people then plot the data on a graph.
Material
A two meter long measuring device (tape measure)
Graph paper
To Do and Notice
Measure the height and wingspan of a group of people, use the same units for both measurements.
Wingspan for a human is outstretched finger tip to outstretched fingertip.
Make a graph of your data.
What do you see?
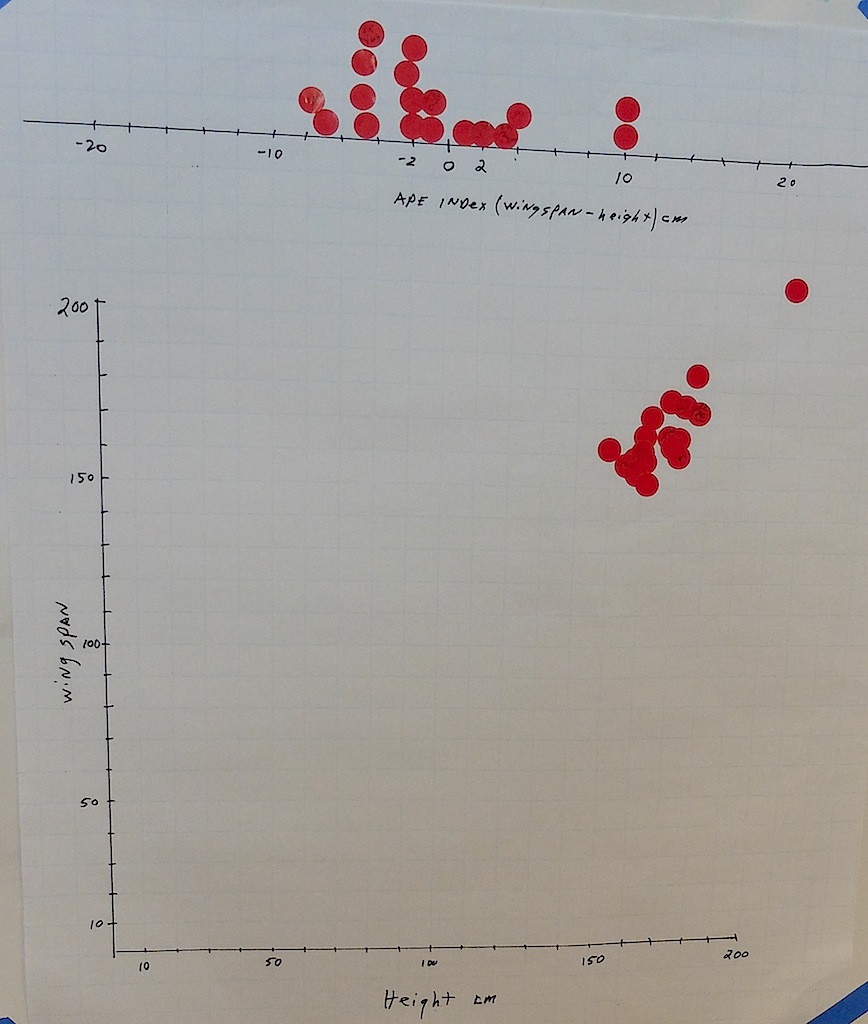
What's going on?
People have a range of heights and a range of wingspans
There is a cluster of data on the graph, this means that there is a relationship between height and wingspan.
Taller people have longer wingspans.
If there were a constant ratio of wingspan to height all people would be points on a line through the origin.
Draw a line of slope 1 through the origin.
The scatter from this line shows the range of ratios for different people
Math Root
On a number line you can also plot the difference between wingspan and height, wingspan minus height.
Mountain climbers refer to this as an ape index.
Notice that the difference can have positive and negative values.