Counting is difficult. Measuring is harder.
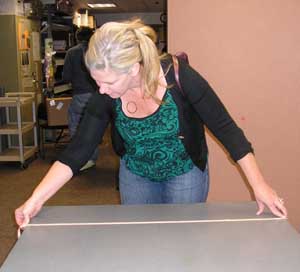
Measure the perimeter and area of a table and study the errors in your measurements.
Material
A rectangular table
A tape measure, ruler, or meter stick
To Do and Notice
Measure the length and width of the table round your answer to the nearest cm while you are at it, also record your measurement to the nearest mm.
I'll assume a table that is W = 1.00 m wide and L = 2.00 m long
You can calculate the perimeter, P, of the table from the length and width, it is P = 2L + 2W
So Calculate the perimeter of your table, P1, to the nearest cm. If I measure my table I will get L = 2.00 +- 0.005 m and W = 1.00 +- 0.005 m
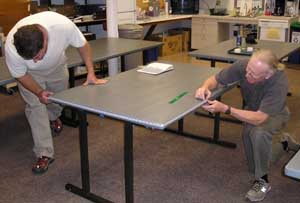
Next measure the perimeter directly, P2.
Compare your two measurements.
When you add or subtract two numbers with errors you add the errors (Yes! you add the errors even when you subtract the numbers.)
So the perimeter is the sum of 4 numbers so you add the errors of all 4, in the first case P1 = 1.00+-0.005m + 1.00 +-0.005m +2.00 +-0.005 m + 2.00 +-0.005 m
P1 = 6.00 +- 0.02 m
How do your calculation of P1 and your measurement of P2 compare ? Are they within the expected error of each other.
What would be the answer if you measured to the nearest mm?
Have other people measure P1 and P2 and collect all the answers.
Now many, N, measurements were made?
What is the average of the measurements P1av = (sum n = 1 to N of P1n)/N
What is the standard deviation of your measurements P1sd = (sum n=1 to N (p1av-p1n)^2)/N)^0.5
usually written 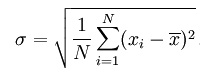
(More about means and standard deviations here: http://en.wikipedia.org/wiki/Standard_deviation )
Here is an online calculator for students which will compute the mean and standard deviation of the numbers you enter.
http://www.business-analysis-made-easy.com/Standard-Deviation-Calculator.html
How do these experimentally determined deviations compare with the round off errors in your measurements?
Part 2 Area
Calculate the area of your table A = L x W
The error in a product is the sum of the percentage errors in the two numbers.
So convert the error in our measurements to percentage errors. 1.00 +- 0.005 m = 1.00 m +- 0.5% and 2.00 +- 0.005 m = 2.00 +- 0.25%
So the area would be A = 2.00 m^2 +- 0.75% or 2.00 +- 0.0015 m^2
Compare many measured areas, calculate the average and standard deviation.
How does the experimentally determined standard deviation compare with your estimated error?
Theory says that there is a 68% chance that your value will be within one standard deviation plus or minus of the average value.
A complete course on errors is here http://web.archive.org/web/20080129065802/http://www.rit.edu/~uphysics/uncertainties/Uncertaintiespart2.html
Part 3 Time and Average Speed
Material
Stopwatch
Ball
To To and Notice
Hold the ball a distance d = 2.0 m above the floor.
Drop the ball and time how long, t, it takes to hit the floor.
Find the average speed of fall Vav = d/t
Do this experiment 8 times and record the results, Or collect the results from at least 8 other groups.
What was the average time for the fall? What was the standard deviation?
Using the standard deviation as the estimate for the error in your sample, what is an estimate for the percentage error in your measurement.
What is an estimate for the percentage error in the average speed. (In division the percentage errors in the two terms add.
What is the estimated error in your measured speed in m/s?
Calculate the predicted time to fall 2m,
t = (2d/g)^0.5 = (2*2.00/9.8)^0.5 = 0.64 s
Etc.
Definition of the meter
The meter was originally defined in 1799 as 1/10,000,000 of the distance from the equator to the pole. This was represented by two scratches on a bar. When the measurement of the distance from the equator to the pole was found to be in error the distance between the scratches was accepted as the definition of the meter. In 1983 the definition was changed to the distance light travels in a vacuum in 1/299,792,458 second. This means that the speed of light is defined as exactly 299,792,458 meters per second.
Definition of the second
The length of a second started in ancient times as 1/60 of 1/60 0f 1/24 of a day, 1/60 of an hour was a minute, and 1/60 of that was a second minute, this was inevitably shortened to a second. In 1670 the second was redefined by a pendulum with a length to make it have a period of 2 seconds. The in 1956 it was defined as 1/31,556,925.9747 of the length of the year 1900, which had obvious problems in terms of keeping the standard in a box in a laboratory. In 1967 it was redefined as the duration os 9,192,631,770 periods of one hyperfine transition of Cesium 133.
Metric prefixesWe all know about km and cm this web page reviews all the metric prefixes.
For example, to detect gravity waves the motion of two mirrors separated by 1.5 km must be measured to within 1 ym, you can use the metric prefix link to figure out how small this is.
Before Hubble the age of the Universe was measured to be 15 Gyr +- 5 Gyr. Gyr = gigayear = 10^9 yr
The age of the universe is now measured to be 13.73 +- 0.12 Gyr by measurements of the big bang made by the Wilkinson Microwave Anisotropy Probe.
The age of the oldest star can be dated by radioactive decay of thorium to europium and is 15.2 +- 3.5 Gyr. (thus the age of the oldest star agrees with the age of the universe withing the error of both.
Atomic Clocks on the GPS satellites keep time to within 1 part in 10^12, that is they gain or lose 1 second in 100,000 years.
The best modern, 2008, atomic clocks are good to 1 part in 10^15.
|
Scientific Explorations with Paul Doherty |
|
18 October 2008 |