The energy budget of the earth. Solar radiation in is 100 units.
The earth reemits 100 units as shortwave (i.e. visible, UV and near IR), and longwave, (i.e. far IR, radiation.)
Climate is what you expect, weather is what you get
Go to the Exploratorium climate explorer website
http://www.exploratorium.edu/climate
Notice that there are tabs on the top of the page for
Home, Atmosphere, Hydrosphere, Cryosphere, Biosphere, and Global Effects.
The Home page links to six pages of introductory images and text about global climate change.
For weather classes, the Atmosphere and Hydrosphere sections are the most useful.
Introduction
One of the most useful images in the introduction is the earth's energy budget diagram. A diagram summarizing electromagnetic radiation which hits the earth and leaves the earth.
Atmosphere
The atmosphere section includes some interesting images.
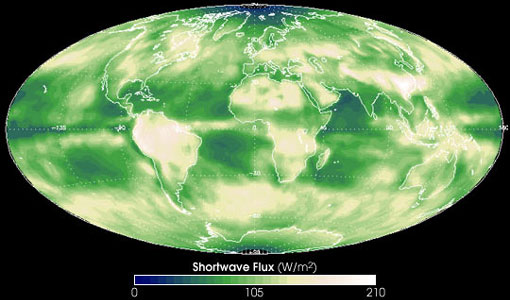
Shortwave electromagnetic radiation from the
earth.
To Do and Notice
Notice which regions on this map reflect the sun's energy back into space: The white or beige areas show sunlight reflecting from Africa's Sahara Desert, as well as from high clouds over the tropical oceans, Amazonia, and tropical Africa. On the other hand, darker areas show sunlight penetrating the atmosphere in the cloud-free areas of the oceans.
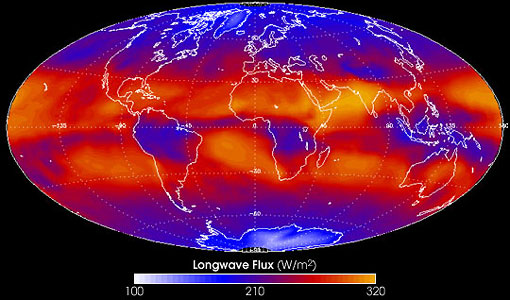
Longwave electromagnetic radiation from the
earth.
To Do and Notice
The orange-red areas of this image show heat being emitted from relatively cloud-free bands north and south of the equator. On the other hand, the dark blue areas over Amazonia, North America, tropical Africa, Indonesia, and Asia show where less heat is being emitted&emdash;in these areas, the earth's heat is being trapped by thick, high clouds. Clouds tend to form over warm areas (like tropical landmasses) as heat rises. The heated air cools as it rises, and the water vapor it contains condenses to form clouds.
The Keeling Curve
Carbon dioxide in the atmosphere traps heat and warms the earth's surface. (Other greenhouse gases also trap heat, as do clouds.) This graph presents measurements of carbon dioxide concentration in the atmosphere over the last half of the twentieth century. These measurements represent continuous air samples taken at a lava field near Hawaii's lofty Mauna Loa volcano. Mauna Loa's remoteness makes it an exceptionally good spot to take such measurements, because influences of vegetation or human activity on the amount of carbon dioxide are minimal. The units of concentration are parts per million by volume.
To Do and Notice
Notice how the carbon dioxide concentration increases with time and how it fluctuates up and down yearly.
|
Scientific Explorations with Paul Doherty |
|
1 November 2003 |